
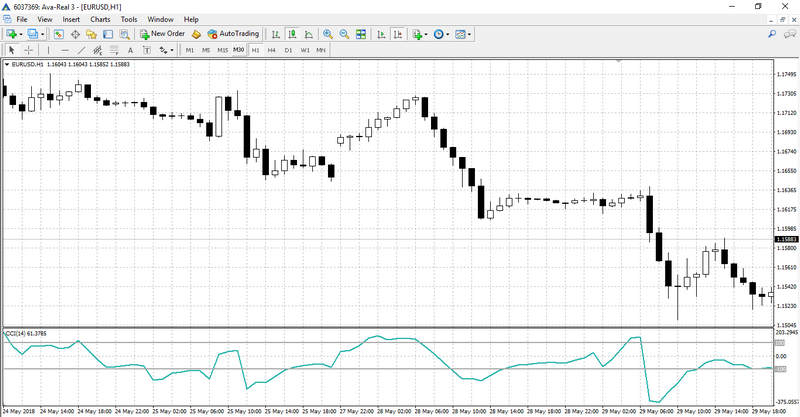
CCI or Commodity Channel Index is an indicator mainly used to confirm momentum price action in stocks or commodities, developed by Donald Lambert in 1980.
Not going deep into calculation let us note down that the indicator generally stays between -100 to 100 & plotted as a sub graph to the price window of the chart.
When CCI of a commodity is between 0 to -100 it is said to be in bearish territory & while CCI is between 0 to +100 it is said to be in bullish territory.
Generally CCI is used for 20 period counts of charts, however some traders often like to use 14 or 10 period counts to increase sensitivity of trade signals. With increased sensitivity of early signals generally risk of higher number of false signals also increases.
However as we have said in the very beginning CCI indicator is more useful in capturing momentum move, a commodity whose CCI crosses +100 is considered to be very bullish and momentum may continue until the CCI falls back below 0.
Similarly a commodity whose CCI crosses -100 is said to be in bearish momentum and the bearishness may fade only when CCI moves above 0.
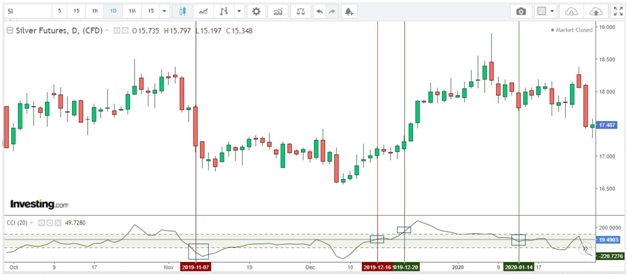
Now the above example was in the daily chart. But, if we talk about intraday trading the role of momentum becomes even more important as the trader has to make entry and exit on the same day itself.
A goal of an intraday trader is to ride the momentum and capture part of a bullish or bearish rapid price move. From that perspective it becomes equally important to learn commodity trading and select appropriate commodities which have generally higher intraday volatility like crude oil, natural gas or silver etc.
Also important is the selection of time frame. For a manual trader it is generally more tough to manage any time frame which is less than 5 minutes as the scope of noise in an extreme shorter time frame is generally on the higher side.
It has been often observed that the ideal timeframe for an intraday trader is 15 min to hourly chart.
15 minutes is generally better than 30 minutes or hourly because most of the intraday rapid moves happen for an hour or two followed by consolidation. Hence the choice of a 15 minutes time frame gives us the opportunity to have timely entries and exits.
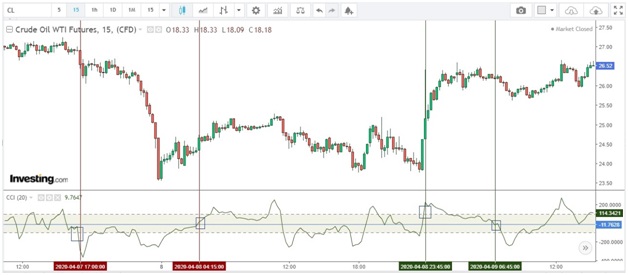
Let us look at the above example in the WTI Crude Oil 15 minutes chart.
By the simple rule of long entry when at the close of candle CCI closes above +100 & exit when CCI closes back below 0 has given a wonderful bullish intraday trade.
In the same chart the entry in short side when CCI closes below -100 and exit when CCI moves back above 0 has given an even better short trade as shown in the chart.
Now exit can also be managed by trailing stop loss, some moving average crossover or some other technical trend-following indicator like supertrend to maximise the gains. Let us look at another example of the same trade methodology in the following natural Gas 15 minute chart.
As we can see that this was such a good trade that momentum carried to the next day also. We have marked the day break with a blue line. Even if one had to exit at close , he/she would have a similar chance the next day to re-enter and make intraday profit on the next day.
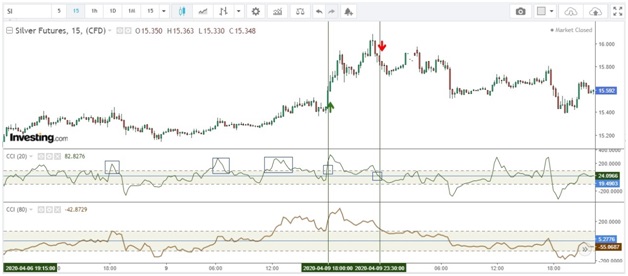
The above rule may work fine for a relatively more volatile commodity like CrudeOil or Natural Gas. But to apply the same rule to a relatively lesser volatile commodity like silver you need to filter the trades with a 80 period CCI along with standard 20 period CCI in a 15 minute chart.
If you think deeply you will understand that an 80 period CCI in a 15 minute chart is a good approximation of a 20 period CCI in an hourly chart.
Well, if one applies the initially defined entry rule only when 80 period CCI in a 15 minute chart is above +100 for buying entry and when 80 period CCI is below -100 for selling, one may avoid many false or useless signals and trade only in the best signals.
In the following chart Silver Chart we can see how we could avoid many poor buy signals earlier and trade only in a better buy opportunity with the help of additional 80 period CCI. CCI is a very useful tool for momentum intraday traders. There can be many more variations. Readers are advised to explore more about it by innivative experimenting.